 |
| pn336 |
StatsNZ goes to some length to say the figures taken from the thrice-yearly Household Economic Surveys are "estimates" (i.e. not "facts"); all the measures used "require judgement calls that reflect underlying assumptions"; the sample sizes were small (2,000 to 5,500), and only about one-third of the households sampled had dependent children, which makes the sample sizes even smaller. They will increase sample size to 20,000 in future surveys.
StatsNZ talked about "trends" to avoid the yearly ups and downs of all sample surveys. They said overall trends tended to be slightly downwards, meaning slightly reduced or relatively even levels of child poverty. They did not comment on individual years but provided numbers and margins of error for each year. Their years ran from June to June— not from January to December as the bloggers seem to have assumed.
The StatsNZ 2018 year, therefore, covered the period from June 2017, when National was in Government, through the General Election on 27 September, to June 2018.
This means that for the 2018 year National was "responsible" for about 4 and Labour for 8 months. This suggests a "shared responsibility" for the apparent increase in poverty in some 2018 measures. If there was, in fact, an increase. And it's far from clear that there was.
Seven of the nine tables show data on low income where varying proportions of households were under the NZ median of households of disposable income before and after housing costs are considered. The other two tables were on household material hardship.
It should be noted that the low income measures overlap and repeat some information contained in other low income tables. 6o% of households, for example, includes the 40% of households counted in another table. Similarly, with household data before and after housing costs. Costs other than housing are included in both sets of tables.
Counting these tables as "stand alone" tables, as SB and Farrar have done, is therefore misleading.
David Farrar concluded that "Child poverty in Labour's first year (actually shared with National. - ACW) increased on seven of the nine measures and dropped on only two of them. Will the media report this with the same vigour as they did hundreds of stories claiming child poverty increased under National?"
To repeat, counting the number of tables in this manner is misleading. There are essentially two sets of independent tables: low income and hardship.
SB in Whaleoil wrote, "The official data by Statistics NZ on child poverty have been released, and they reveal that seven of the nine measures of child poverty decreased under National. It also shows that on seven of the measures it increased in Labour’s first year." Both of these statements are false because the table data overlaps, sampling errors, and the "sharing" of 2018 between National and Labour. She ignores or seems unaware of these caveats.
"Ooops, she continues, "this was one of Jacinda Ardern’s big election promises. How embarrassing that her government has done the opposite of what she had promised. The only thing she can use in her defence is to point out that even Statistics NZ admit that their “baselines estimates” must be used with 'caution'". Unfortunately, SB ignored this advice.
The Tables
I have converted StatsNZ tables into bar graphs to make them more instantly understandable. Table 1 now becomes Figure 1, and so on.
Bear with me as we quickly review each table, remembering that Labour formed the Government from 1997 to 2008 (the earliest table starts in 2007), National from 2008 to 2017, and National-then-Labour from June 2017 to June 2018.


Figure 2 shows a general trend downwards, meaning there has been a small improvement since 2009. The only yearly difference that was statistically significant was the increase in low income households between 2010-2011. There was an overall downward trend under National from 2009. The small increase under National and Labour from 2017 to 2018 was not statistically significant.

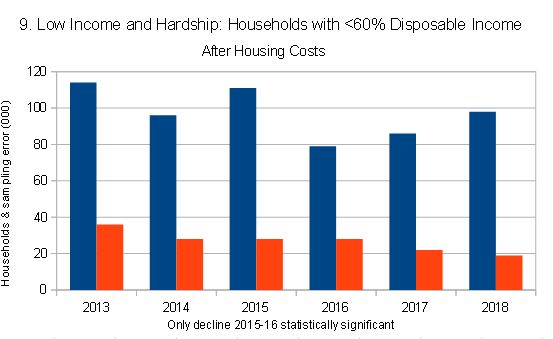
Figure 3 is the first of two on material hardship. The improvement from 2015-16 was statistically significant. The slight increase in 2018 could have been due to sampling error.

Figure 4 showed little change since 2007 except for the increase in those on low incomes from 2017 to 2018.


Figure 6 shows a small increase in low income household in 2008 after National won the 2017 election and no significant change or improvement until 2018. Overall, there was little change.

Figure 7 shows no significant change or improvement under National from 2008 to 2017, and a slight but not statistically significantly improvement under National-Labour from June 2017 to June 2018.

Figure 8 shows a general improvement overall, deterioration from 2013-15, a significant improvement in 2016, followed by a significant deterioration in 2017, all under National, and a small but not significant improvement under National-Labour in 2018. The "seesawing" of results reflects the nature of sample polls.
Summary
So what really is happening? Overall, there seems to have been little change on some low income measures and a slight improvement on others under National, and an "erratic" performance on the two hardship measures, with recent years showing some improvement. To claim that the situation has significantly improved under National is not borne out by the data.
It really is too soon to know what is happening under Labour. The 2018 figures from June 2017 include only eight months under a Labour government, but even a whole year would not be enough as the yearly ups and downs from 2008 to 2017 under National show.
Of the nine figures, four — all low income measures whose data overlap, 40-60% of households, and the same data including and excluding housing costs — are suggestive of a worse situation in 2018 than in 2017. The hardship measures were also inconclusive. Severe Hardship showed an small but statistically not significant improvement in 2018.
Looking back at how I have spent the past several hours preparing this post, it now seems to be all about almost nothing, but I had to go though it, just to satisfy myself, and keep the likes of SB and David Farrar on their toes.
-- ACW
No comments:
Post a Comment