 |
| Hosking's view of aid See link above. pn179 |
Ardern defends NZ Aid
Hosking gets it wrong, as usual
_________________
Ian Mitchell* and Caitlin McKee
* Deputy Director for CGD Europe and Senior Policy Fellow
November 15, 2018
Donors have lost their focus on aid effectiveness in the last decade, limiting aid’s impact. Here we report on new results of one of the few measures of aid “quality”—the Quality of Official Development Assistance (QuODA), which aims to bring aid effectiveness back into focus. Aid effectiveness still matters enormously to the world’s poor; donors should revisit effective aid principles and agree measures which take better account of today’s challenges and context.
Below we look at how we can currently measure aid effectiveness, how countries and multilateral donors rank, and where the agenda should go next. Across the measures, New Zealand, Denmark, and Australia rank highest. The results also highlight what many countries can and should improve on: eliminating tied aid and enhancing the use of recipient country systems and priorities.
How can we measure aid effectiveness?
Even careful evaluations sometimes struggle to effectively measure aid impact. So how do we assess entire countries?
One way is to look at indicators associated with effective aid. The OECD donor countries agreed on a number of principles and measures in a series of high-level meetings on aid effectiveness that culminated in the Paris Declaration on Aid Effectiveness (2005), the Accra Agenda for Action (2008), and the Busan Partnership Agreement (2011). Our CGD and Brookings colleagues—led by Nancy Birdsall and Homi Kharas—developed QuODA by calculating indicators based largely on these principles and grouping them into four themes: maximising efficiency, fostering institutions, reducing burdens, and transparency and learning.
The indicators include some things which are firmly backed by evidence. For example, tied aid (aid that must be spent on goods and services from the donor country) can increase the costs of a project by up to 30 percent. Many indicators have a sound theoretical base—for example, giving transparently, and in countries or sectors where the donor has a specialisation, or avoiding giving aid through a large number of agencies (potentially making it complex and burdensome for recipients).
Some of the indicators are juxtaposed. In particular, the share spent in poorer countries (where it could make more difference) and the share to well-governed countries (which we expect to increase aid effectiveness). It’s hard to do well in both.
QuODA’s 24 aid effectiveness indicators are listed below and we’ve published a detailed methodology along with the data. The scores given to the 27 bilateral country donors and 13 multilateral agencies we consider is the simple average of all the indicators after they have been standardised.
Figure 1. Aid effectiveness (QuODA) indicators 2018
Many of these indicators now rely on the excellent analytical work of the Global Partnership for Effective Development Co-operation (GPEDC). That body has a much broader focus than aid, and high-level attention on aid effectiveness has waned since Busan in 2011. It’s hard to argue the generation and presentation of hard evidence about (lack of) progress has, to date, driven behavioural change. It’s unclear whether the 2018 monitoring round and the upcoming “senior-level meeting” in 2019 will succeed in reinvigorating effectiveness amongst donors.
Which country scores best on aid quality?
We collate indicators of aid effectiveness and compare them across donors with the ultimate goal of improving aid effectiveness. By ranking countries, we draw attention to the results.
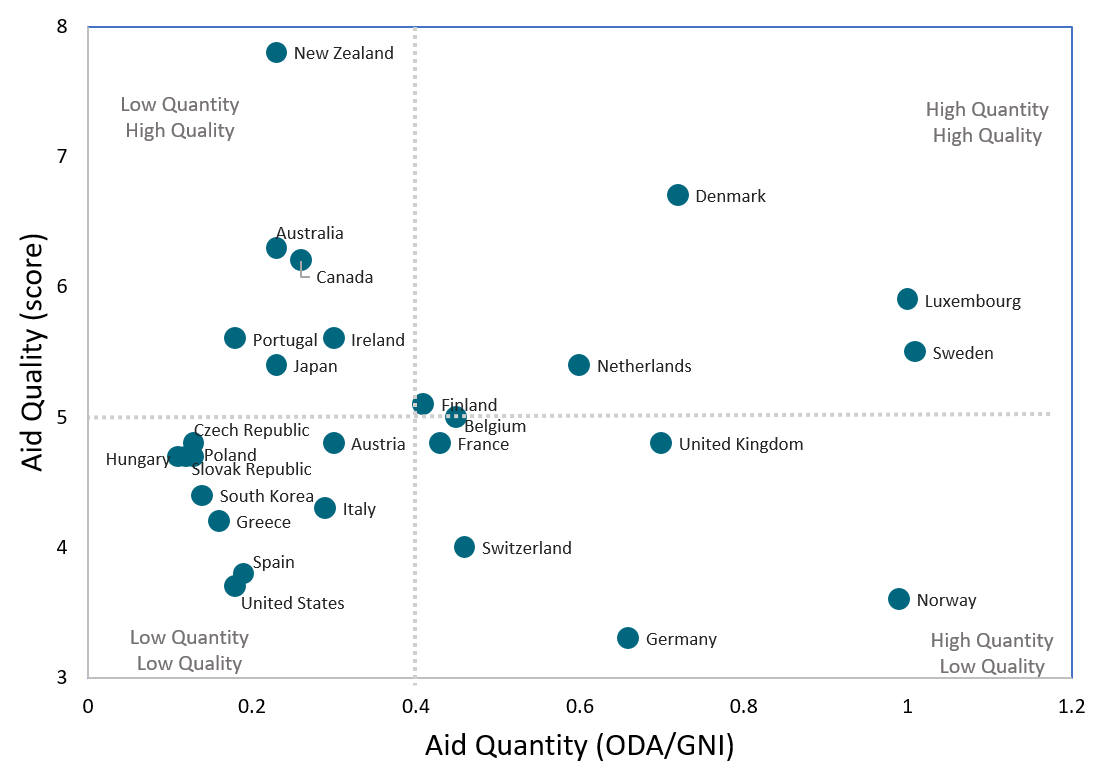
The overall quality of aid for each country donor is scored as a weighted sum of bilateral and multilateral effectiveness (on average, countries spend about a third multilaterally). Overall aid quality for countries is measured on the y-axis of the below chart (and we use them in the annual Commitment to Development Index).
Figure 2. Aid quality and quantity

Notes: Aid “quality” is a standardised measure with a mean of 5 and variance of 1. ODI/ GNI is official development assistance over gross national income in 2017 from the OECD. The dotted lines represent the mean of the 27 countries assessed.
New Zealand has the highest score for overall aid quality, with Denmark and Australia in second and third place. Luxembourg, Sweden, and the Netherlands score well on both quality and quality. The lowest rankings were the US, Norway (despite giving a high quantity of aid), and—at the bottom—Germany.
These results do not mean that New Zealand has the best aid and Germany has the worst. There’s an excellent critique of whether New Zealand is really the best aid donor and the limitations of our approach. However, to rank near the top, you must be doing important things well—for example, on the indicators of transparency (which Norway doesn’t). Similarly, on maximising efficiency, you must give aid that’s untied (the US doesn’t). You might also want to ensure that your aid isn’t fragmented across too many countries by too many agencies (Germany doesn’t do well on these indicators).
Multilateral agencies versus country bilateral aid
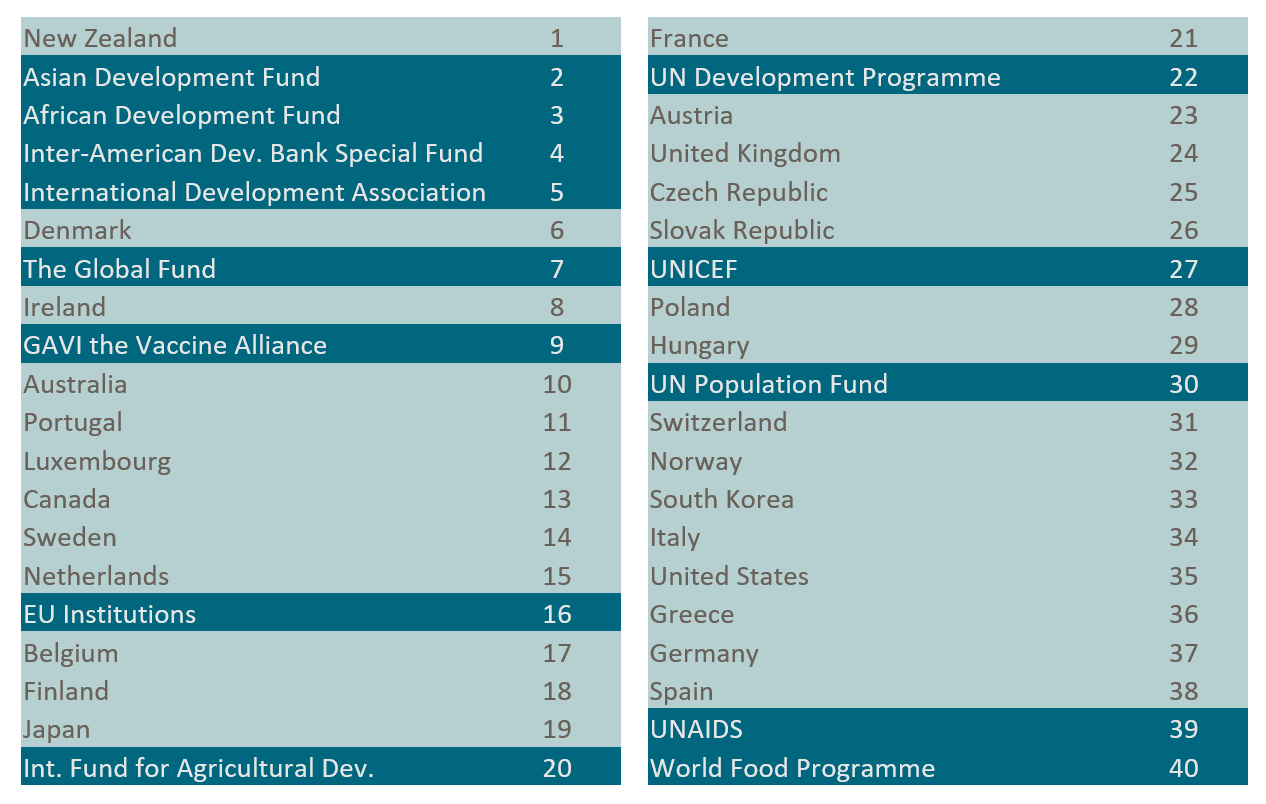
The aid quality scores above represent a weighted average of countries’ bilateral and multilateral spend. The results below break down the aid effectiveness performance for multilateral agencies compared to the bilateral aid of donor countries.
Figure 3. Aid quality ranking of bilateral countries and international agencies

Note: Donors in dark blue are multilateral agencies, donors in light blue are the bilateral portion of countries’ aid
The table shows there is wide variation when comparing relative performance of multilateral agencies to bilateral donors. Overall, multilateral development funds (based in the regional development banks and World Bank) rank highest, taking four of the top five spots, and the UN agencies all fall in the bottom half.
When considering just the bilateral portion of countries’ aid, Ireland moves into one of the top three countries.
UK bilateral aid ranks 24th out of 40 donors while EU institutions rank 16th. To the extent that the indicators assessed in QuODA are a guide to aid effectiveness, several multilaterals offer a more effective route for the UK to support development post-Brexit if it no longer funds the EU institutions.
The aid effectiveness agenda needs renewal
The aid effectiveness agenda was defined in a different era, when most aid was government aid to governments of stable low-income countries. The principles that were adopted were sensible for aid in that context, but aid now is for different purposes, in different places, given through different channels and with different instruments.
To modernise measures of effectiveness we are going to need principles that are differently calibrated for different kinds of aid. Some donor agencies should be more specialised and concentrated, some should not. In some countries it would be more effective to work through country systems, in others not. The country-led approach might make sense for public services but not for supporting private enterprise.
The aid effectiveness agenda resulted from years of righteous frustration by developing countries at the ineffectiveness of donor behaviours. We need an update to reflect the changed context of aid today. It’s time to start talking about aid effectiveness again.
The authors would like to thank Mikaela Gavas and Owen Barder for very insightful comments on an earlier draft.
If you’re an official in an aid agency, do please consider what drives your institution’s results and where and how you could improve. And we’d be keen to hear about evidence or views on the indicators included and what’s missing.
* Ian Mitchell bio.https://www.cgdev.org/expert/ian-mitchell
RELATED TOPICS:
Aid Effectiveness, QuODA
DISCLAIMER
CGD blog posts reflect the views of the authors drawing on prior research and experience in their areas of expertise. CGD does not take institutional positions.
No comments:
Post a Comment